
Figures
The data behind the work, drawn. Each figure is dated and sourced, with its table and a downloadable image.
Does not count: A live feed. Each figure is dated to the day it was read.
RWA perps
Where the open interest sits.
Nearly three quarters of RWA perps open interest is on centralized exchanges 13 November 2026
Of $13.35b in open interest, $3.55b sits on decentralized venues. There, public equities hold about 45%.
All RWA perps open interest, $13.35b
Decentralized venuesCentralized exchanges
Decentralized venues only, $3.55b, by asset group
Table
| Asset group | Open interest, decentralized venues |
|---|---|
| Public equities | $1.6b |
| Precious metals | $551.5m |
| Equity indices | $496.9m |
| Oil | $294.8m |
| Equity ETFs | $196.6m |
| Fiat currencies | $182m |
| Private equity and venture | $171.9m |
| AI and compute infrastructure | $48.7m |
| Natural gas | $21.4m |
| Industrial metals | $14.4m |
| All groups, decentralized venues | $3.55b |
| All venues | $13.35b |
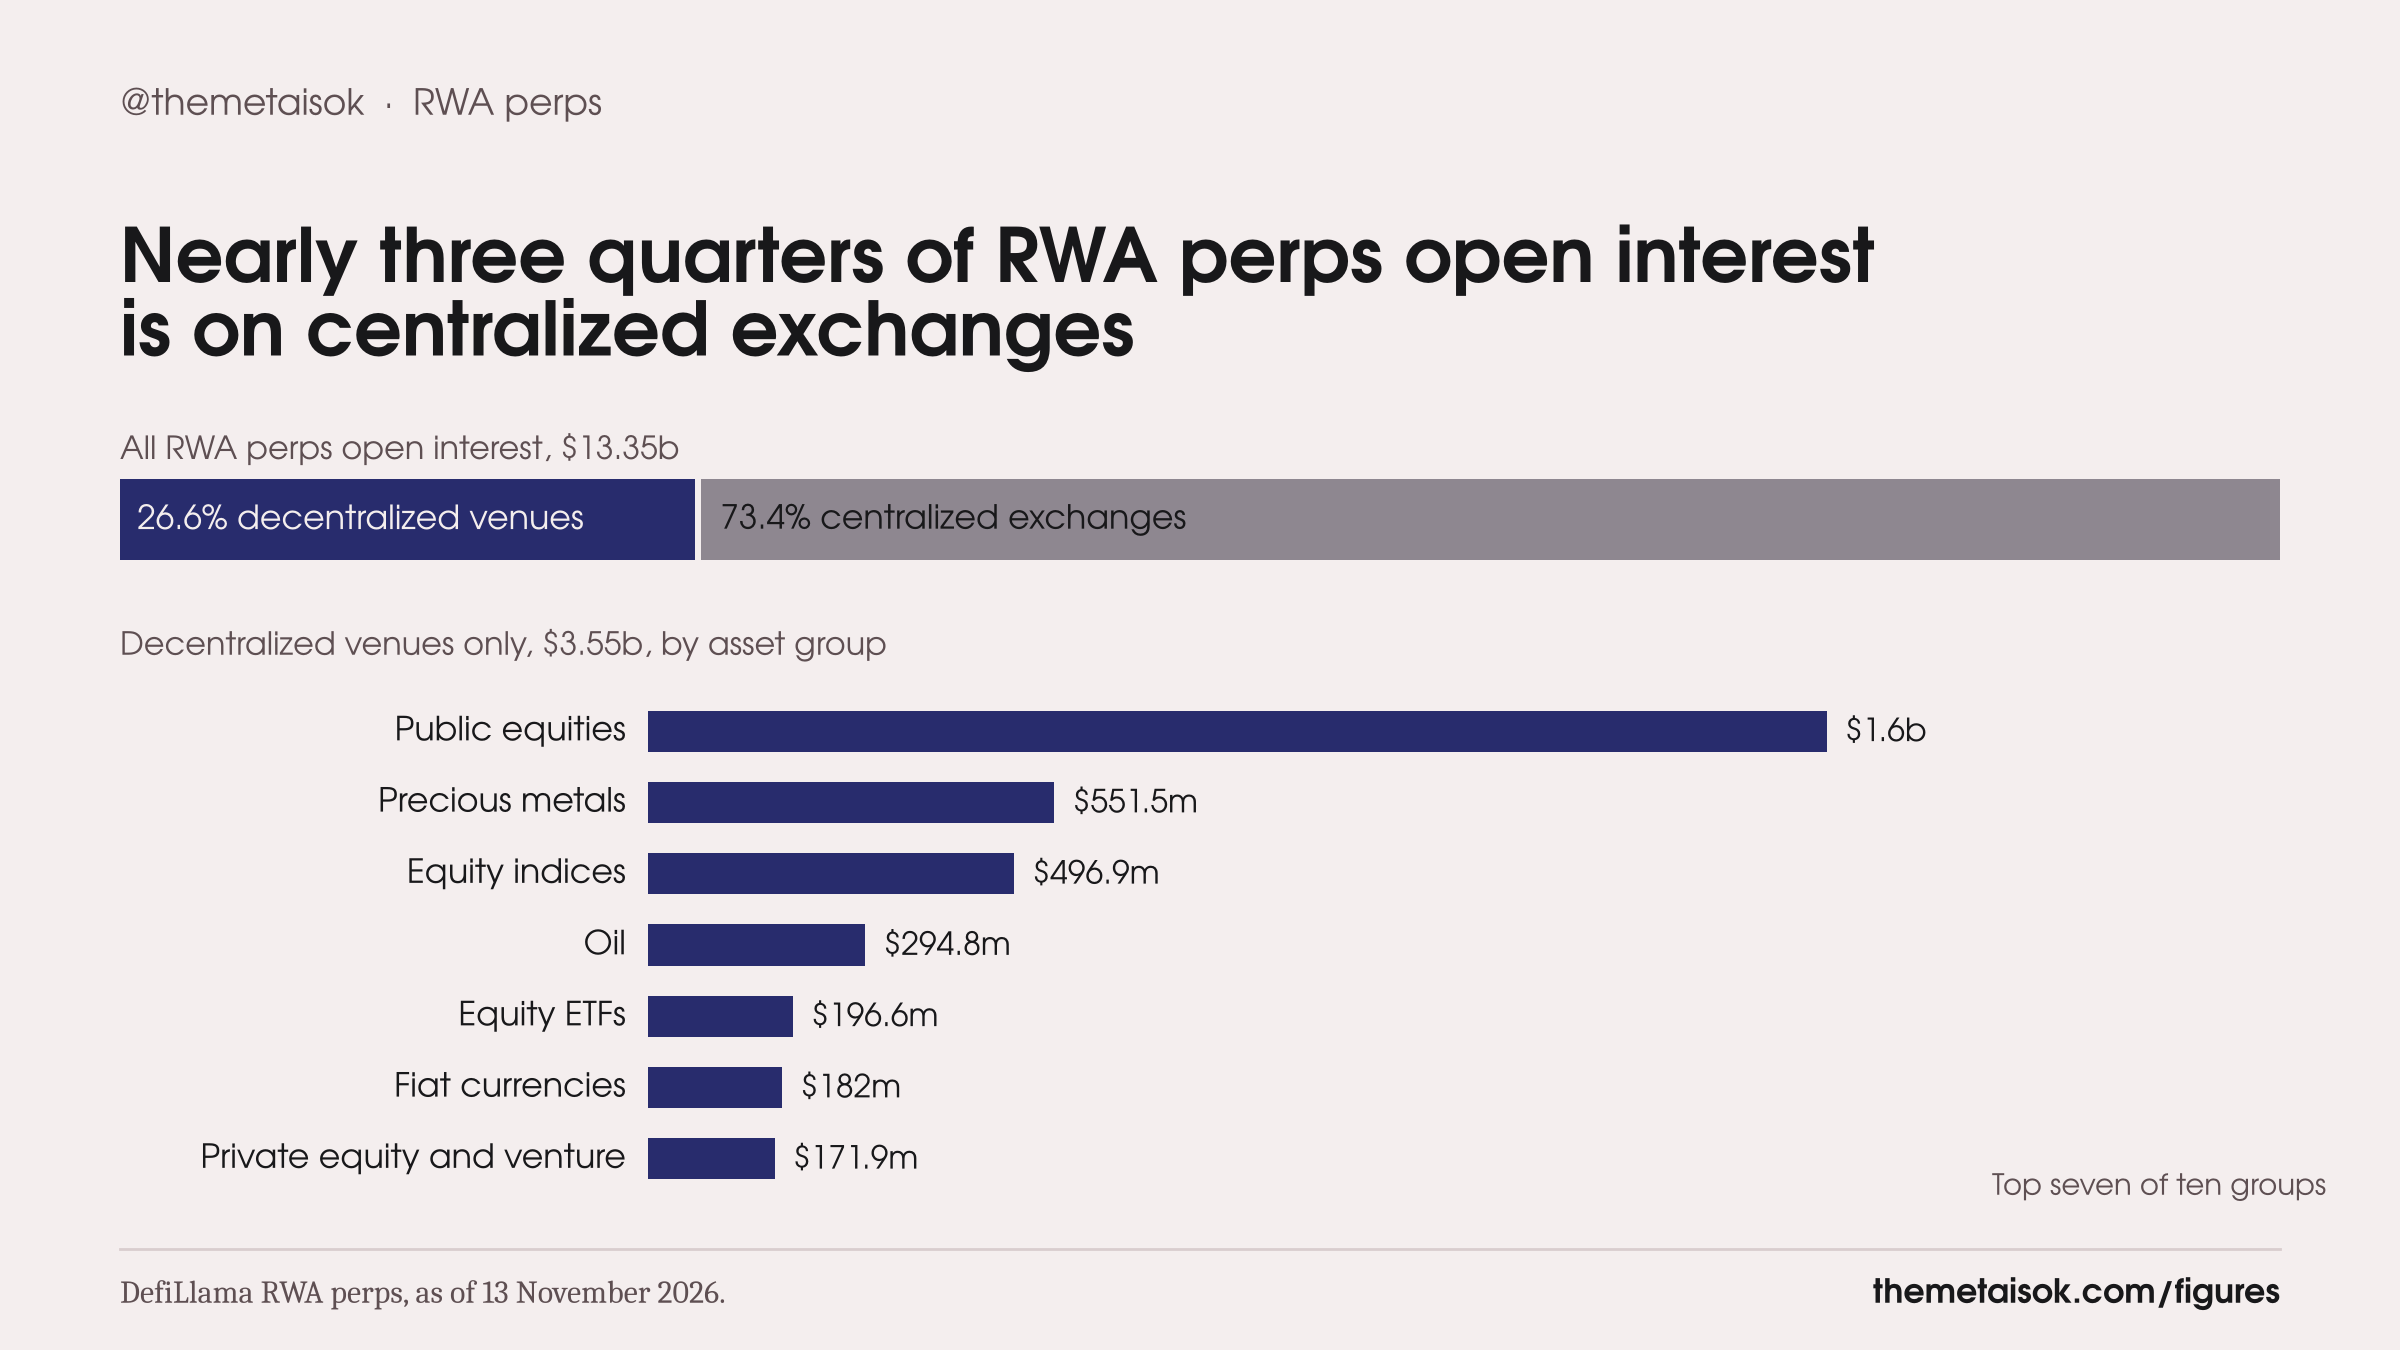
Does not count: The market, read from onchain data alone. Decentralized venues carry about a quarter of RWA perps open interest. A tracker that reads only them misses the other three quarters.
Used in DeFi
Three of the measures I defined, on one scale.
About an eighth of onchain real-world assets is used in DeFi 13 November 2026
Most of what’s onchain is also in user hands. Very little of it is put to work.
12.2% utilization, DeFi Active TVL over Onchain Market Cap
Table
| Measure | 13 November 2026 |
|---|---|
| Onchain Market Cap | $34.414b |
| Active Market Cap | $30.481b |
| DeFi Active TVL | $4.191b |
| Utilization | 12.2% |
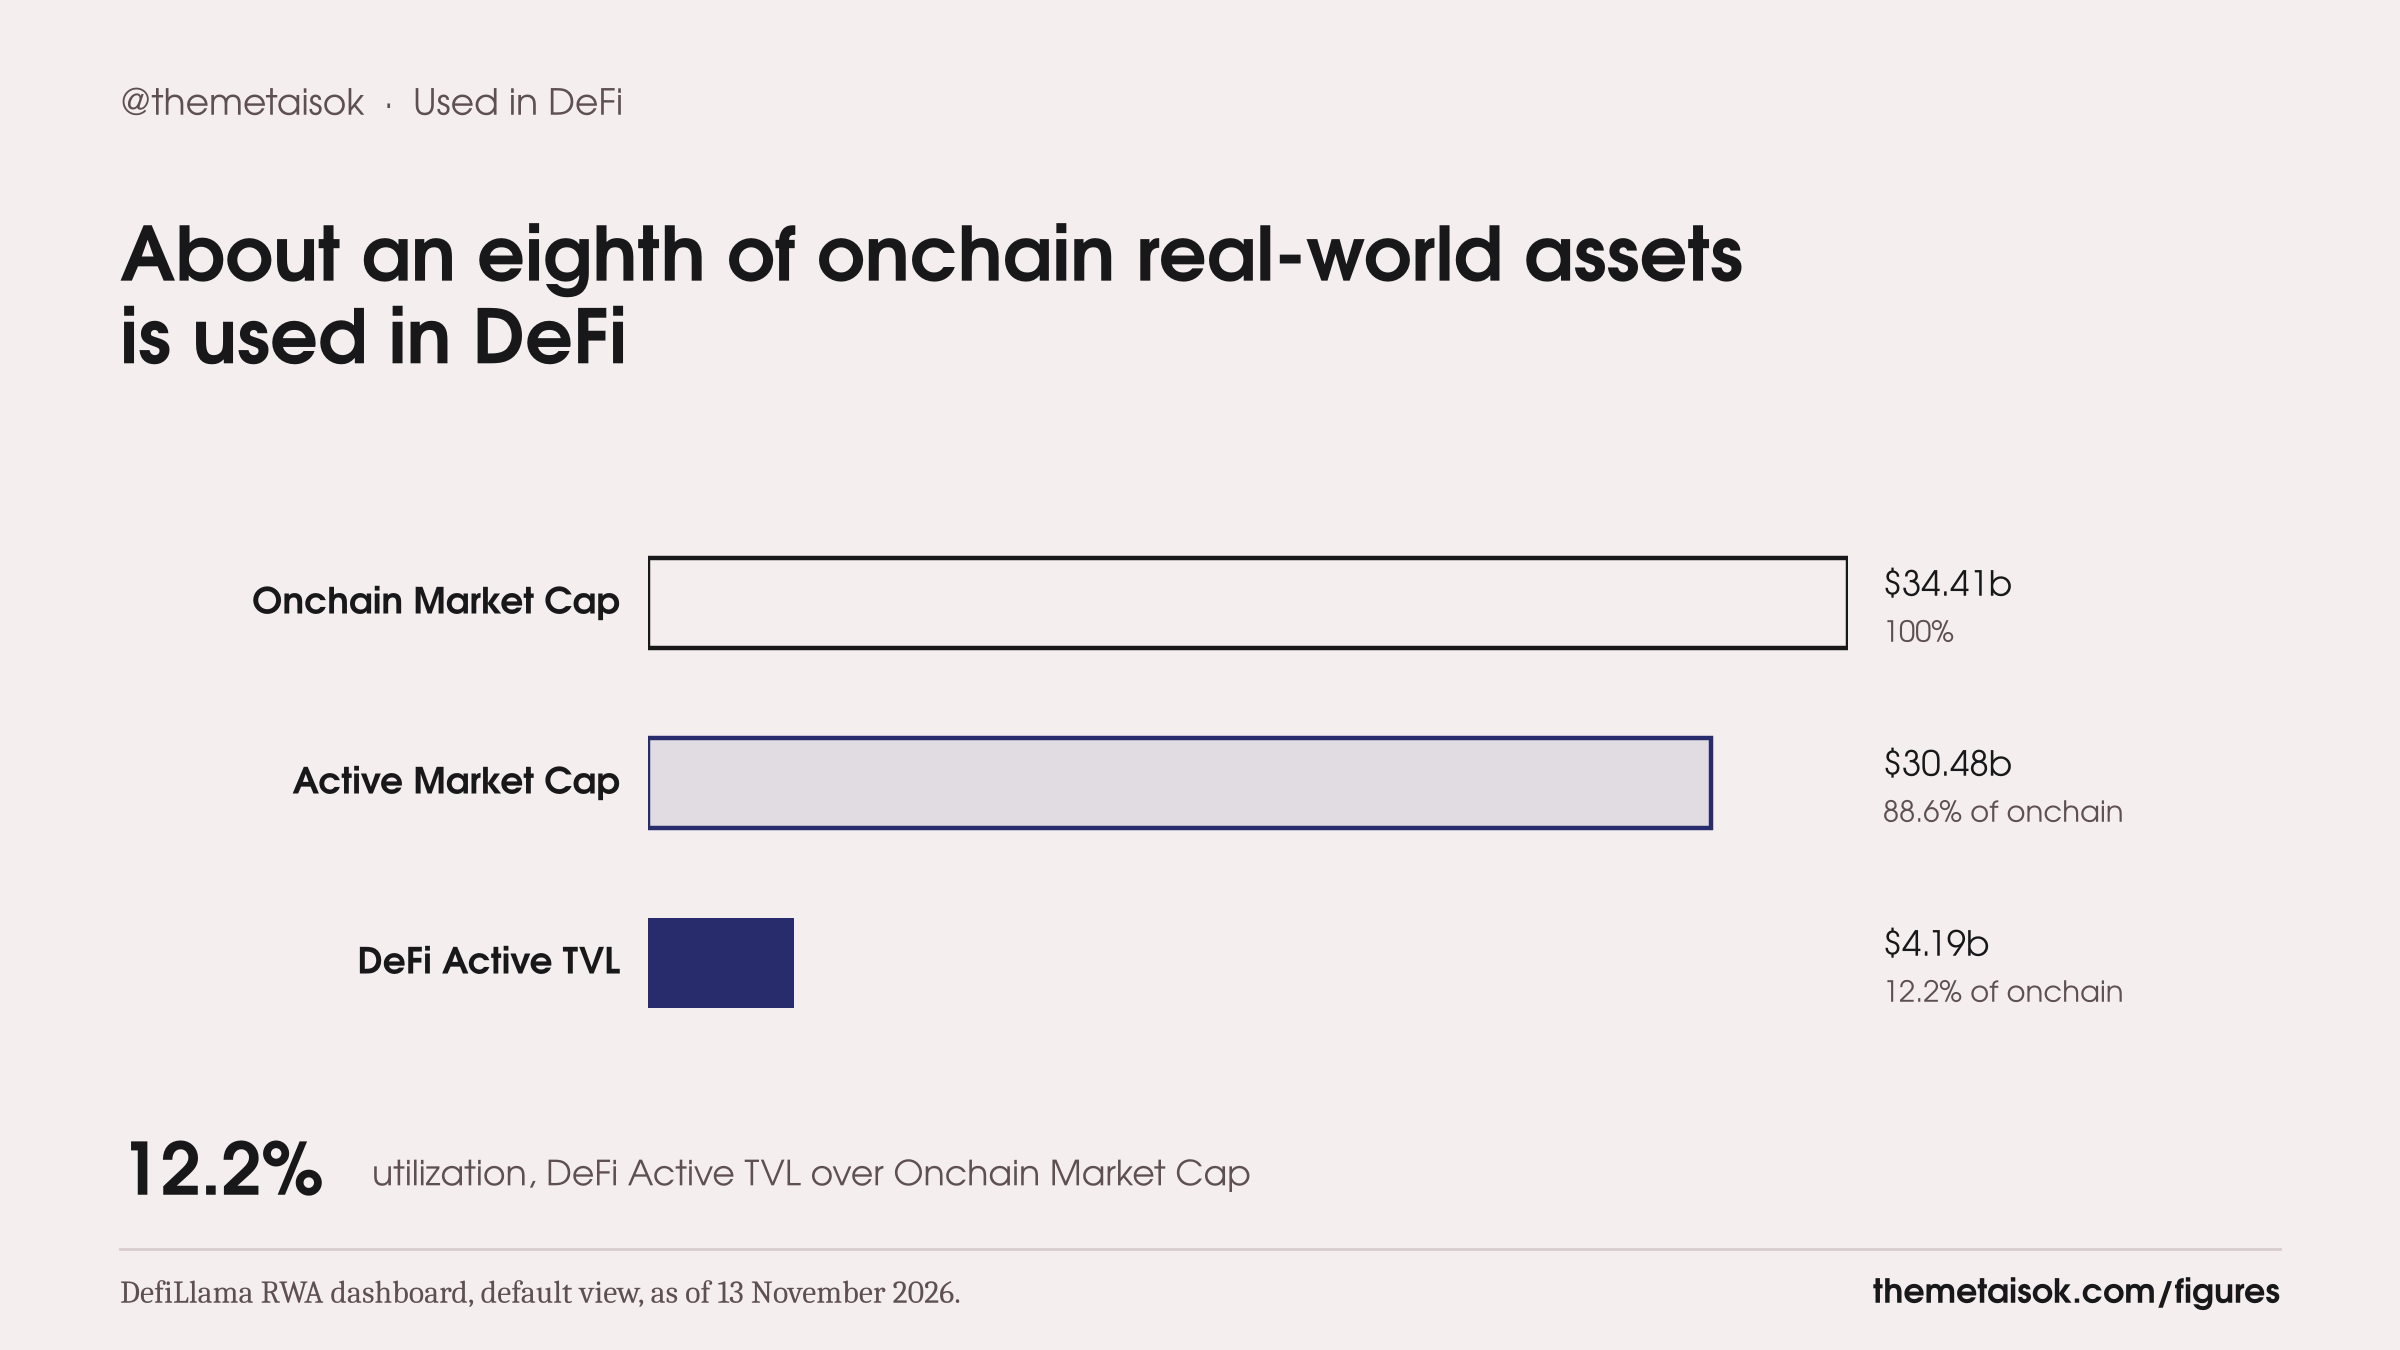
Does not count: Onchain as in use. About $1 in every $8 of real-world assets onchain is deployed in DeFi. The rest is simply held, much as it would be off chain.
The record
What I published, and when other people picked it up.
Published first, picked up after August 2025 to November 2026
Month by month, from joining DefiLlama to now.
Joined DefiLlama
“What is mNAV?”, DL News
“The Digital Asset Treasury Playbook”, DL News
CriptoNoticiasSpanish-language coverage of the RWA data
Pantera Capital, Q1 2026 editionAdopts DeFi Active TVL
Citi InstituteMarket size sourced to DefiLlama, p. 19
Vella, Pennella, and BallandiesarXiv paper, DefiLlama as selection criterion
CryptoSlateRuns DeFi Active TVL as a column heading
Went independent
Pantera Capital, September 2026 editionCredits me by name again
Indexed podcast
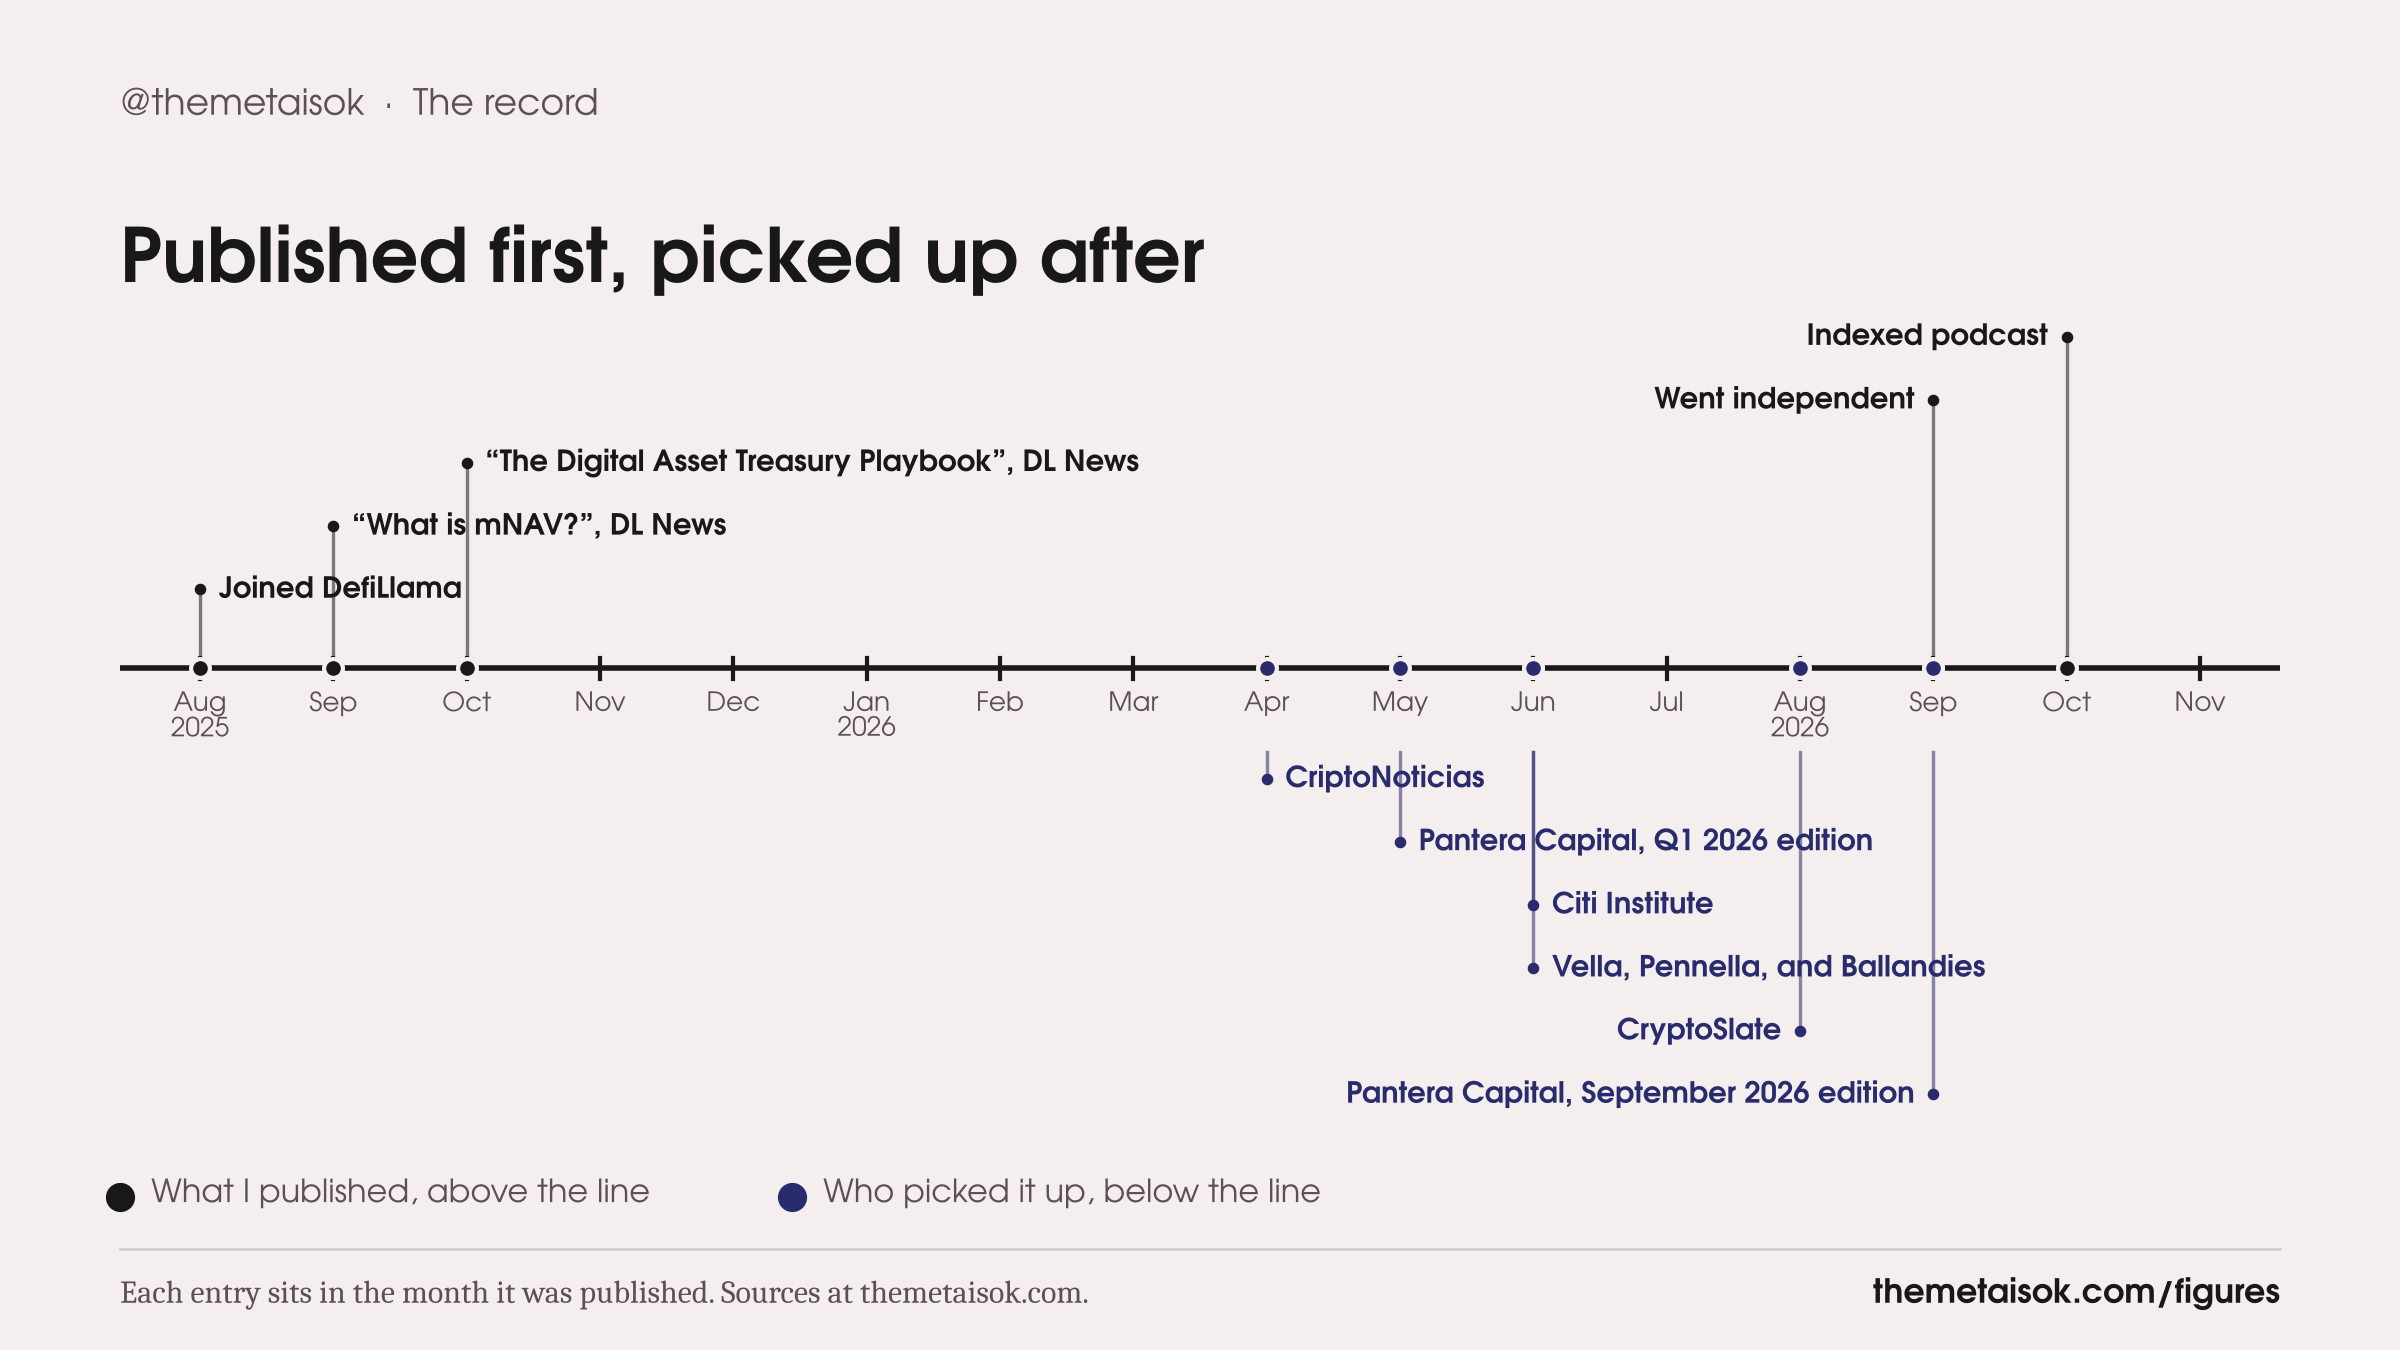
Does not count: Overnight adoption. Six months passed between the second article and the first pickup. Then six pickups landed between April and September 2026.
Questions about a figure, or one you’d like drawn: themetaisok@gmail.com. Back to the main page.
Not affiliated with DefiLlama or Meta Platforms. Nothing here is investment advice.
Data from DefiLlama’s public dashboards, dated where it’s drawn.